
Pricing Tip Prediction for New Hosts in New York
In this part, we decided to build a machine learning model to help the new Airbnb hosts set their price.
Data Processing
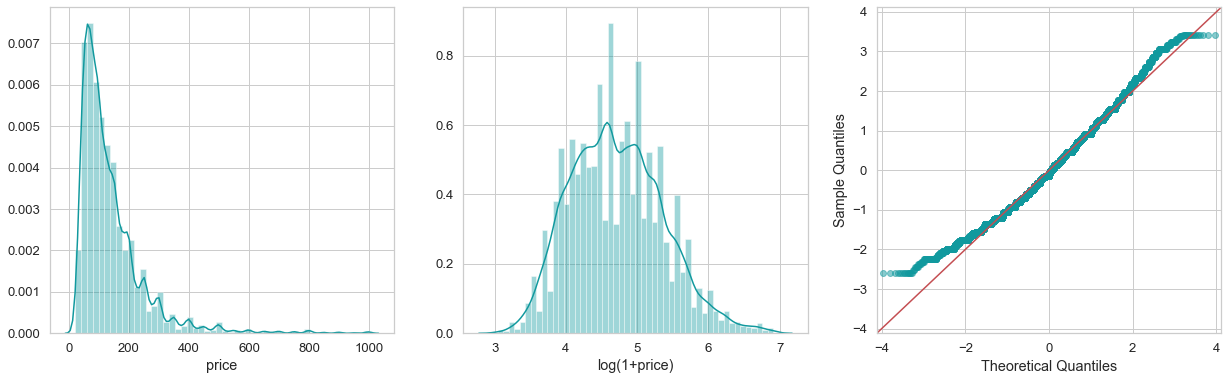
The first step of data processing is handling outliers. We examined the price distribution, filtered the outliers, as well as removed the NA value of potential features. The final dataset contains 26624 observations.
Before
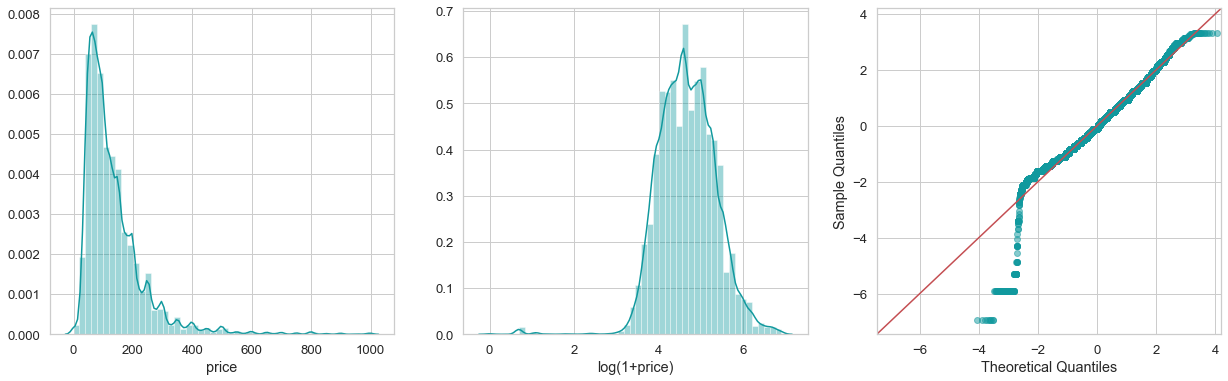
airbnb_gpd = airbnb_gpd [(np.log1p(airbnb_gpd ['price']) < 8) & (np.log1p(airbnb_gpd ['price']) >3)]
airbnb_gpd=airbnb_gpd.dropna()
len(airbnb_gpd)
26624
After
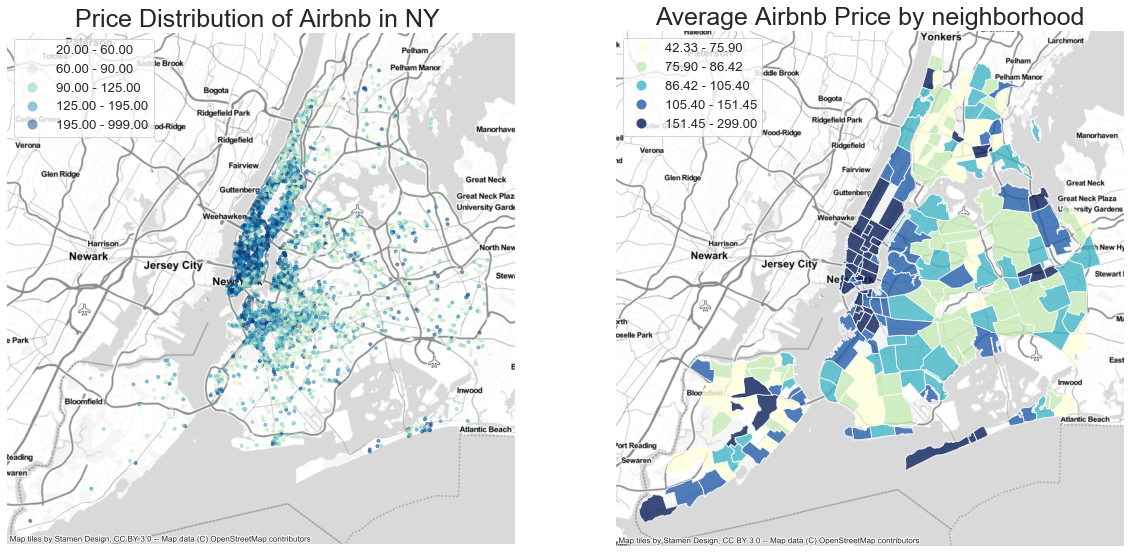
To get a sense of the spatial distribution of Airbnb price in New York, we visualized the price of Airbnb by their locations.Besides,we also plot a price map by neighbourhood. The following maps indicates that the Airbnb prices exhibit strong spatial autocorrelation.
Feature Engineering
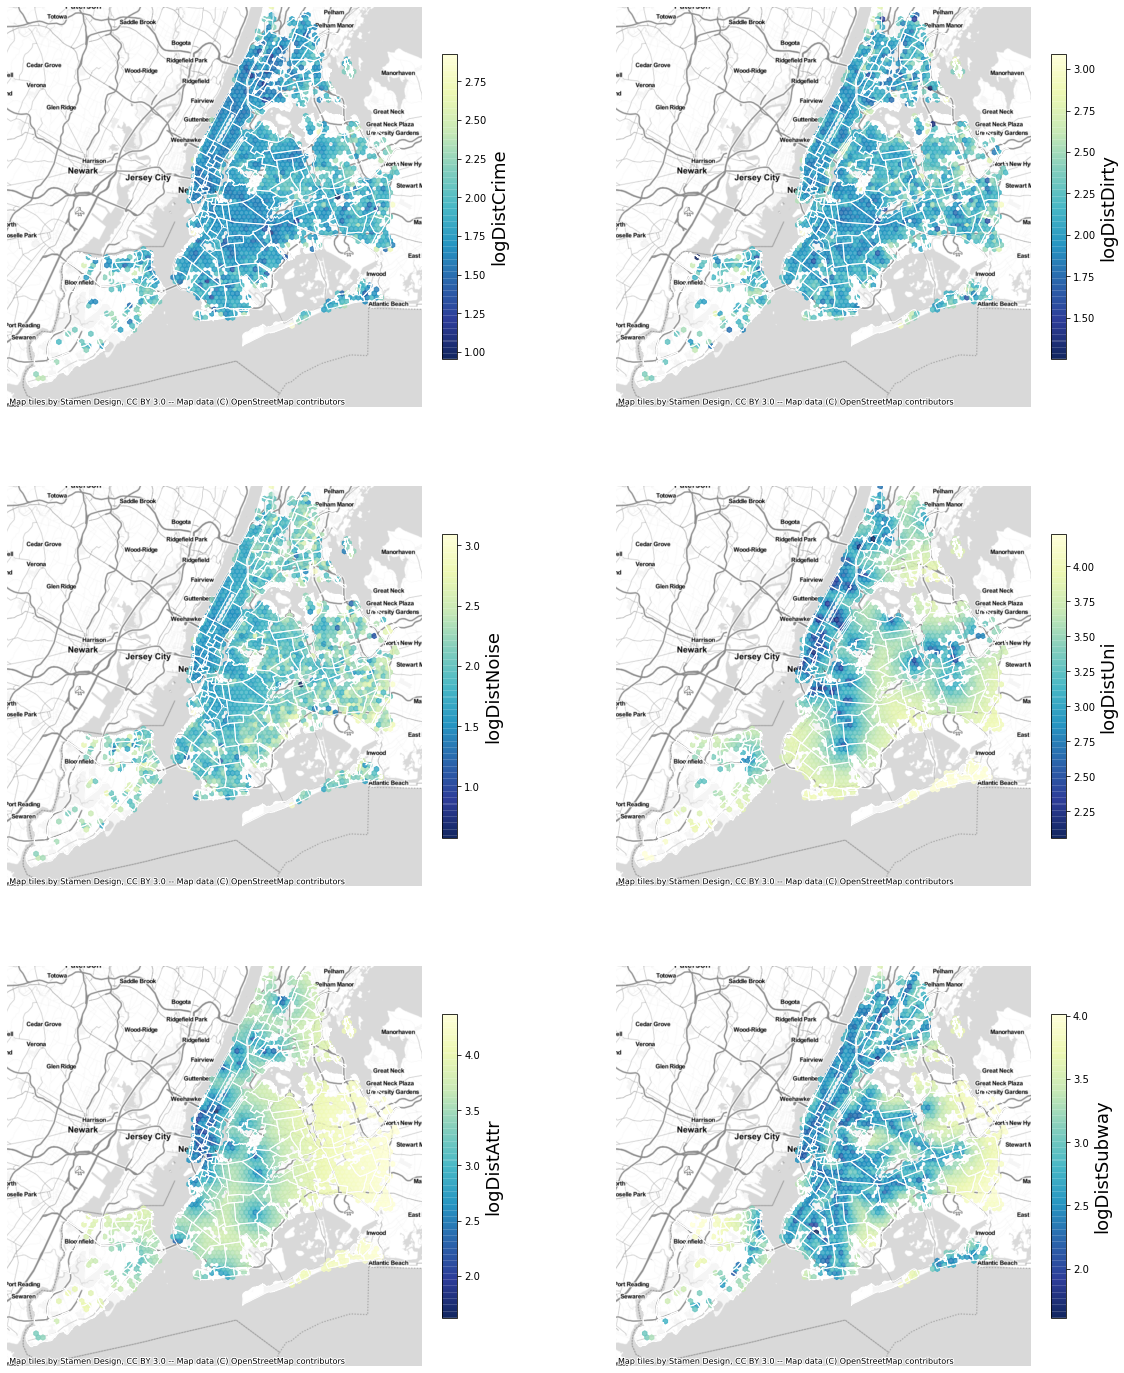
We selected several potential variables that might influence the price of Airbnband, and loaded the data from NY opendata and OSM, including the crime data, 311 requests data, university, subway and attractions.
Below, we engineered the features and show the distance between Airbnb and the average distance to the 5 nearest crimes,3 nearest 311 calls for dirty condition,1 nearest 311 calls for noise, 3 nearest attractions, 1 nearest university and 1 nearest subway station.
To eliminate the effects of spatial autocorrelation, a new feature named LaggedPrice is developed to account for the neighborhood effect, which indicates the average price of each Airbnb’s 5 nearest Airbnb. The final variables are listed as follows:
# Numerical columns
num_cols = [
     'accommodates',
     'bathrooms',
     'bedrooms',
     'guests_included',
     'beds',
     'review_scores_rating',
     'reviews_per_month',
     'logDistCrime',
     'logDistNoise',
     'logDistDirty',
     'logDistSubway',
     'logDistAttr',
     'logDistUni',
     'LaggedPrice'
]
# Categorical columns
cat_cols = [ 'host_identity_verified',
             'instant_bookable',
             'neighbourhood',
             'room_type',
             'cancellation_policy'
           ]
# Set up the column transformer with two transformers
# Scale the numerical columns and one-hot
preprocessor = ColumnTransformer(
    transformers=[
        ("num", StandardScaler(), num_cols),
        ("cat", OneHotEncoder(handle_unknown="ignore"), cat_cols),
    ]
)
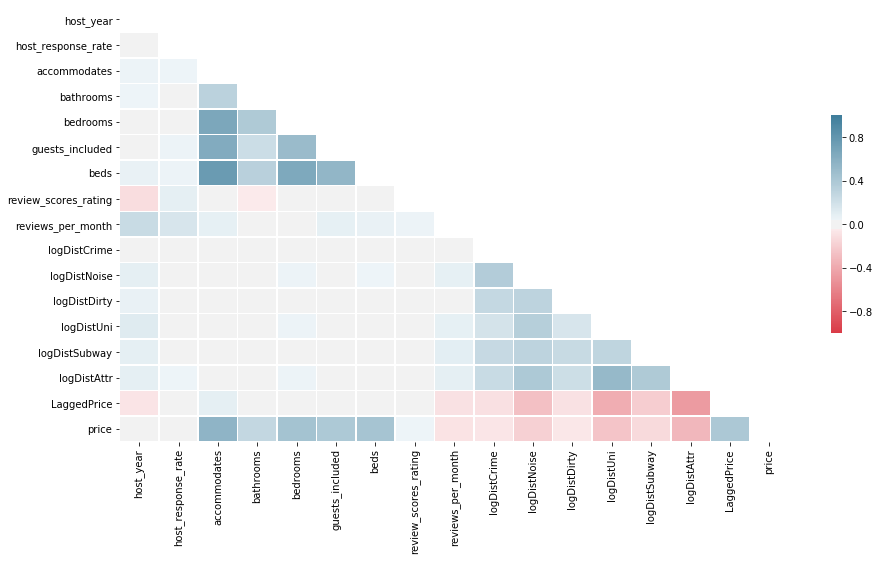
A correlation matrix was created to examined the correlation between those numerical variables.
Modeling
After correlation analysis, we used a 70/30% training/test split and built an randomforest regression model. the result of testing score is as follows:
# Evaluate the score on the test set using the best_params_
regressor = make_pipeline(preprocessor, RandomForestRegressor(n_estimators=100,max_depth=13,random_state=42))
# Fit the training set
regressor.fit(train_set, y_train);
#  the test score
print(f"Testing Score = {regressor.score(test_set, y_test)}")
Testing Score = 0.7291985385199888
A testing score of 0.73 indicates that this algorithm could serve as an relatively ideal predicting model.Then, We plot a bar chart of feature importance, the top 3 important features is entire home/apt dummy variable, LaggedPrice and logDisAttr.
Validation
For the test set, we calculated the predicted price, percent error as well as absolute percent error for each observation.
# Predictions for log of total trip counts
log_predictions = regressor.predict(test_set)
# Convert the predicted test values from log
test_set['prediction'] = np.exp(log_predictions)
test_set['percent_error']=(test_set['prediction']-test_set['price'])/test_set['prediction']
test_set['abs_percent_error']=abs(test_set['percent_error'])
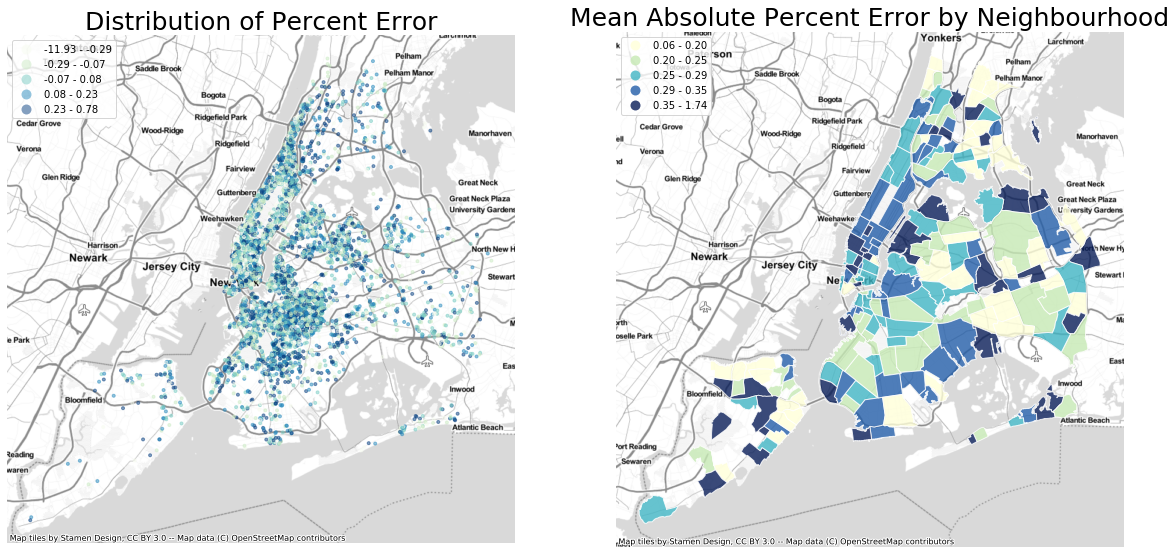
To further examine the spatial autocorrelation, we visualized the spatial distribution of the percent error , as well as the mean absolute percet error by neighborhood in test set. It is clearly that the errors of prediction Airbnb price have few spatial cluster (i.e.The ones with high error are clustered together, and so do the ones with low error), which means the effects of spatial autocorrelation have reduced a lot.
Overall, though remaining a few flaws in our model, we still believe that this model will perform well in Airbnb which enjoys a wider range of data collection channels.This new pricing guide feature could be attached in User Interface, and hosts that subscribe this feature could be charged in reasonable price.